AlignRNA
Complete bulk RNA-seq analysis: QC, differential expression, batch correction, and pathway enrichment
The Challenge
Bulk RNA-seq experiments generate thousands of expression measurements, but transforming count matrices into meaningful biological conclusions requires careful statistical analysis and expert interpretation. Researchers face dozens of decisions: which normalization method to apply, how to handle batch effects, which differential expression framework to use, what enrichment approach captures the biology best.
Without dedicated bioinformatics expertise, it’s easy to miss important findings or, worse, draw conclusions from statistical noise. The difference between a list of differentially expressed genes and actionable biological insight requires judgment that goes beyond running software.
How AlignRNA Helps
AlignRNA is a complete bulk RNA-seq analysis platform available in three tiers — Core, Pro, and Advanced — so you get exactly the analytical depth your project requires.
Core: Differential Expression & Pathway Analysis
The Core tier provides comprehensive differential expression analysis using limma-voom, the gold standard methodology for bulk RNA-seq. This approach handles the mean-variance relationship inherent in count data while providing robust statistical inference even with modest sample sizes of 3-4 replicates per group.
Beyond identifying differentially expressed genes, Core delivers pathway-level insights through both over-representation analysis (ORA) and gene set enrichment analysis (GSEA). This dual approach captures both strongly differentially expressed genes and coordinated changes across entire biological pathways that might be missed by single-gene analysis.
Pro: Multi-Engine DE & Batch Correction
The Pro tier adds DESeq2 as a second differential expression engine, letting you compare results between methods or choose the best approach for your experimental design. Batch correction is built in via sva (surrogate variable analysis) and ComBat, with visual diagnostics (PCA before/after) to verify correction effectiveness.
Pathway enrichment expands to four complementary approaches: clusterProfiler for GO/KEGG over-representation, GAGE for pathway-level differential expression, GSVA for sample-level enrichment scoring, and pathview for KEGG pathway visualization. This multi-method strategy captures different aspects of the biology that any single approach would miss.
Advanced: Interactive Shiny UI
The Advanced tier wraps the full analytical engine in an interactive Shiny application with a 6-tab guided workflow that takes you from raw counts to publication figures without writing a single line of code. Both Human and Mouse organisms are natively supported with automatic gene annotation.
Built as a two-package R ecosystem — core engine (41 exported functions) plus Shiny app — the Advanced tier produces publication-ready figures at every step: QC plots, PCA, volcano plots, MA plots, heatmaps, enrichment dotplots, and KEGG pathway maps.
Every analysis includes expert review for biological plausibility. We flag potential batch effects, identify genes that may represent technical artifacts, and highlight findings that warrant follow-up validation.
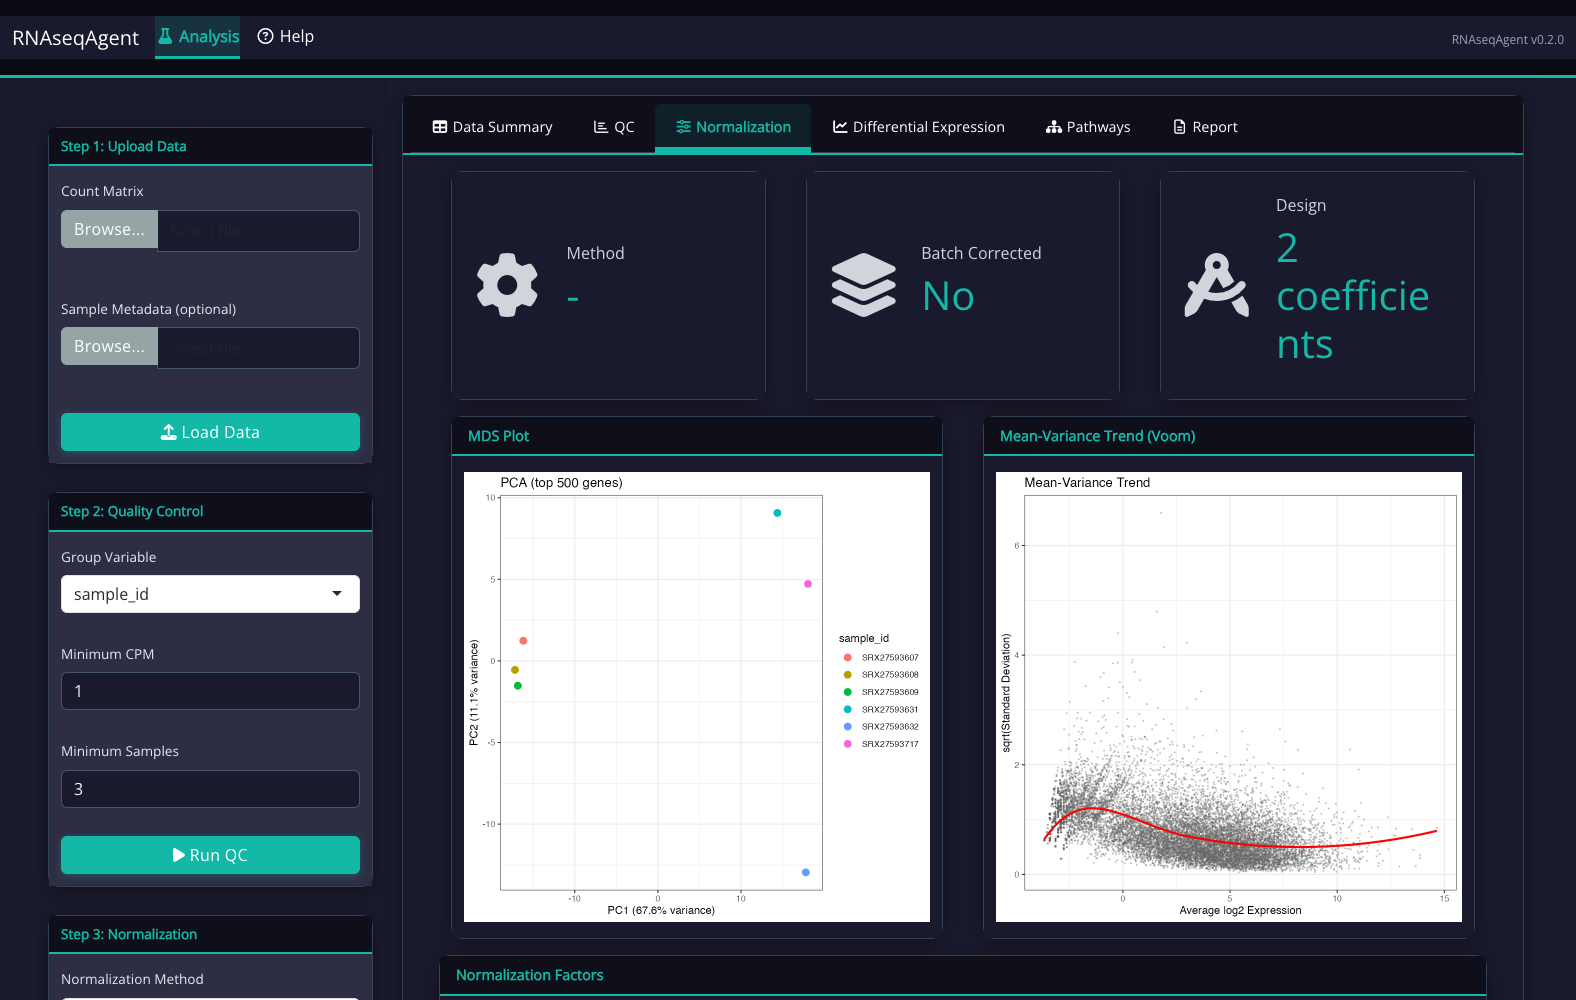
The AlignRNA Interface
Step-by-step guided workflow with dark theme optimized for extended analysis sessions:


What You Receive
Dual DE Analysis
Differential expression results from limma-voom (all tiers) and DESeq2 (Pro/Advanced) with full statistics — log2 fold changes, adjusted p-values, and gene annotations for every gene.
Multi-Method Enrichment
Core: ORA + GSEA. Pro/Advanced: adds GO/KEGG via clusterProfiler, GAGE, GSVA sample-level scoring, and pathview KEGG pathway maps.
Publication-Ready Figures
High-resolution volcano plots, heatmaps, pathway dotplots, PCA visualizations, MA plots, and KEGG pathway maps formatted for journal submission.
Expert Review Notes
Interpretation notes highlighting key findings, potential artifacts to consider, batch effect assessment, and suggested follow-up experiments or validations.
Methodology
DESeq2
TMM normalization
ComBat / sva
clusterProfiler
GSVA
GSEA
pathview
MSigDB
Bioconductor
AlignRNA implements the limma-voom pipeline (Law et al., 2014) and DESeq2 (Love et al., 2014) for differential expression. TMM normalization accounts for compositional differences between samples, while voom transformation models the mean-variance relationship for accurate statistical testing.
Batch correction uses sva for surrogate variable estimation and ComBat for known batch removal, with visual diagnostics to verify correction effectiveness. Pathway analysis combines clusterProfiler (Wu et al., 2021), GAGE for generally applicable gene set enrichment, and GSVA for sample-level pathway scoring.
Validation: Cross-validated against benchmark datasets with >0.99 correlation in fold-change estimates between engines and >88% overlap in significant gene calls. The Advanced tier passes 170 unit tests with 0 R CMD check errors across the two-package architecture.
Ideal For
- Treatment vs. control comparisons in cell lines or animal models
- Time-course experiments with multiple timepoints
- Multi-factor designs with batch effects requiring correction
- Cohort studies comparing patient groups
- Labs comparing DESeq2 vs limma-voom results on the same dataset
- Researchers who need end-to-end RNA-seq analysis without command-line bioinformatics
- Studies requiring multi-method pathway enrichment (GO, KEGG, Reactome)
- Any bulk RNA-seq experiment with standard count matrices
Start Your Analysis
Ready to analyze your data with AlignRNA? Submit your project and we'll scope a plan tailored to your experimental design.