AlignSpace
Spatial transcriptomics analysis for Visium and Xenium platforms
The Challenge
Spatial transcriptomics preserves what single-cell dissociation destroys: the spatial organization of cells within tissue. But this additional dimension brings analytical complexity. Researchers must identify spatially variable genes, define tissue domains, deconvolve mixed cell populations within spots, and characterize the spatial relationships between cell types—all while accounting for technical factors specific to spatial platforms.
The field is young, methods are evolving rapidly, and the gap between raw Space Ranger output and biological insight requires specialized expertise that most research labs don’t have in-house.
How AlignSpace Helps
AlignSpace provides comprehensive spatial transcriptomic analysis supporting both 10X Genomics platforms: Visium (55μm spot-based) and Xenium (subcellular resolution). Our 10-module workflow addresses the full spectrum of spatial analysis challenges.
Spatially variable gene detection identifies genes whose expression patterns are organized across tissue space—whether forming gradients, clusters, or more complex arrangements. These genes often reveal tissue organization principles invisible to non-spatial methods.
Spatial clustering and domain identification segments your tissue into transcriptionally coherent regions. This unsupervised approach discovers tissue architecture from the data itself, identifying microenvironments, anatomical structures, and pathological regions.
For Visium data, cell type deconvolution using RCTD or SPOTlight estimates the cellular composition of each spot by leveraging single-cell reference data. This connects your spatial observations to known cell populations, even when individual cells cannot be resolved.
Spatial niche analysis characterizes the tissue microenvironment by examining which cell types colocalize and how their spatial relationships correlate with biological outcomes. This is particularly valuable for understanding tumor-immune interfaces and stem cell niches.
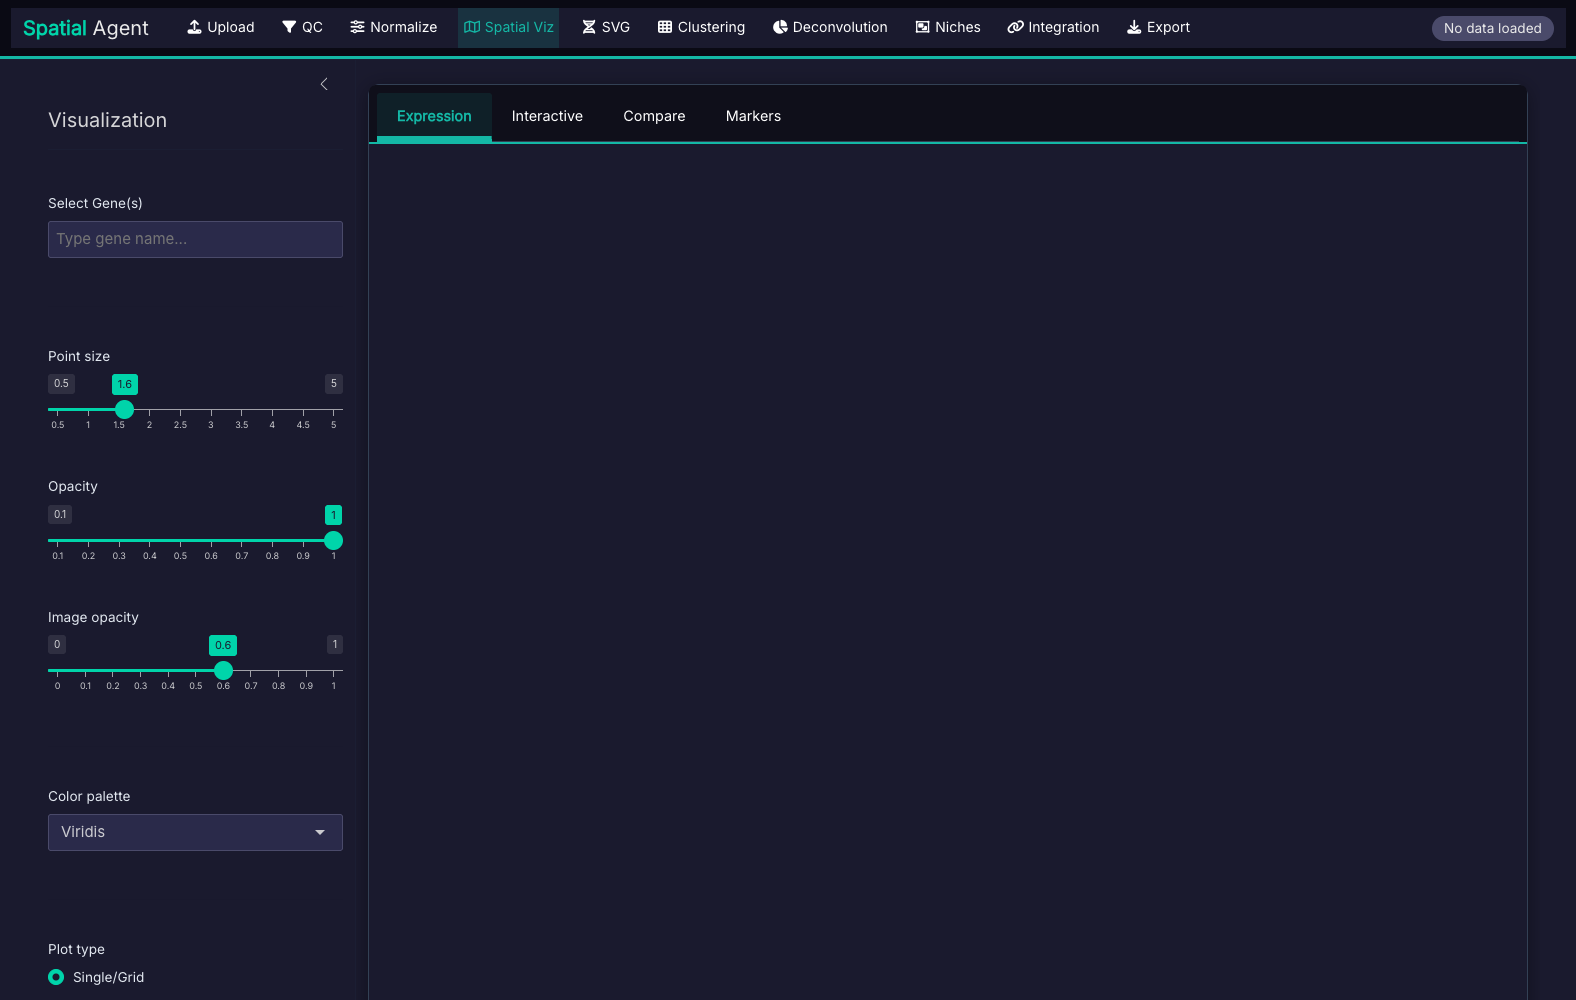
The AlignSpace Interface
10-step workflow supporting both Visium and Xenium platforms:


What You Receive
Spatial Visualizations
Gene expression patterns, spatial domains, and cell type distributions overlaid on histology images ready for publication.
Domain Annotations
Tissue segmentation with domain labels, marker genes per domain, and spatial context interpretation.
Deconvolution Results
Cell type proportions per spot/cell, spatial distribution maps, and niche characterization when reference data is available.
SVG Analysis
Ranked lists of spatially variable genes with statistical significance and spatial pattern classification.
Methodology
RCTD
SPOTlight
Moran’s I
SCTransform
AlignSpace implements methods from the Seurat spatial analysis framework and specialized tools including RCTD for robust deconvolution and Moran’s I for spatially variable gene detection.
Our team has experience with diverse tissue types and can adapt analytical approaches to the specific challenges of your samples, whether tumor biopsies, developmental tissues, or specialized organ sections.
Ideal For
- 10X Visium experiments on FFPE or fresh-frozen tissue
- Xenium targeted panels for high-resolution spatial mapping
- Tumor microenvironment studies requiring spatial context
- Developmental biology with tissue architecture questions
- Any spatial transcriptomics experiment needing domain identification or deconvolution
Start Your Analysis
Ready to analyze your data with AlignSpace? Submit your project and we'll scope a plan tailored to your experimental design.